9.3 Use Case 3: Fluid Sample Characterization
| Topic Version | 1 | Published | 12/09/2016 | |
| For Standard | PRODML v2.0 | |||
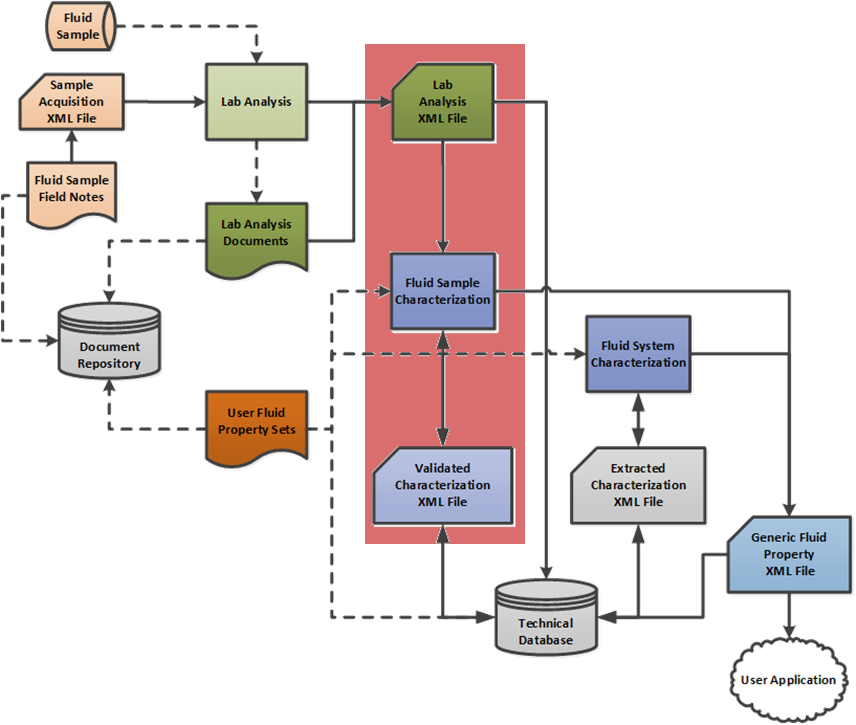
Figure 9.3-1 shows the next step in the fluid and PVT analysis life cycle, sample characterization. The goal of this step is to develop a mathematical model that can faithfully reproduce the observed laboratory measurements for a single fluid sample. This model may then be used to calculate the properties of the fluid system (i.e., system characterization, the next use case) for historical field conditions or for various depletion strategies (such as EOR), which is the process of building a numerical model of the laboratory measurements from an individual sample and determining the quality of the results received from laboratory fluid analysis. This use case involves a QC and verification of the samples and results.
After the laboratory analysis is received, the usual first action is to complete a consistency and correctness check of the data. If the information coming from the laboratory is found to be non-coherent or not self-consistent, the laboratory may be requested to repeat some or all the experiments, if possible. In other cases, to increase the confidence in the results, some or all of the experiments may be repeated, either by the original laboratory or by another laboratory. Regardless of validity, all measurements on fluid samples may be potential candidates for characterization and may be described by the fluid analysis data object. For example, a sample that may have too much gas may form a basis for a future sensitivity analysis.
In the past, samples were characterized using traditional methods, such as direct input of the lab data superimposed with correlations/smoothing functions and possibly coupled with K-value charts or correlations. To convey this legacy data, the tabular format (see 10.6.2 Tabular Output ) could be used. Modern reports, however, are overwhelmingly analyzed using tools with built-in EoS engines for which the parametric format is appropriate. Either or both of these formats may be used as needed for a specific set of results. The final goal of the PVT workflow, regardless of the points of origin, is to use it in the tools that help in engineering decisions.
Conducting the sample characterization soon after the PVT test makes it easier to repeat or add some of experiments if needed. However, in the current business environment or depending on the in-company processes, staff turnover may be an impediment to the technical level continuity issues, depending on how long it takes to complete the full cycle analysis. Many times, it is difficult to locate the correct data unless it has been properly categorized, indexed and stored. The fluid analysis data object is designed to carry to system identifiers throughout its lifecycle to make this task easier and more consistent.