11.1.6 Fluid Characterization
| Topic Version | 1 | Published | 12/09/2016 | |
| For Standard | PRODML v2.0 | |||
There are two ways in which a fluid can be characterized. Both can be mixed in the same fluid characterization data object. Here they are shown in two worked examples.
- Fluid characterization using models (file: Good Oil 4.ModelCharacterization).
- Fluid characterization using tables (file: Good Oil 4.TabularCharacterization).
The high level content of the model approach is shown in Figure 11.1.6-1 . The tabular approach follows later and shares the same high-level data elements, but adds tabular data in place of (or in addition to) model data.
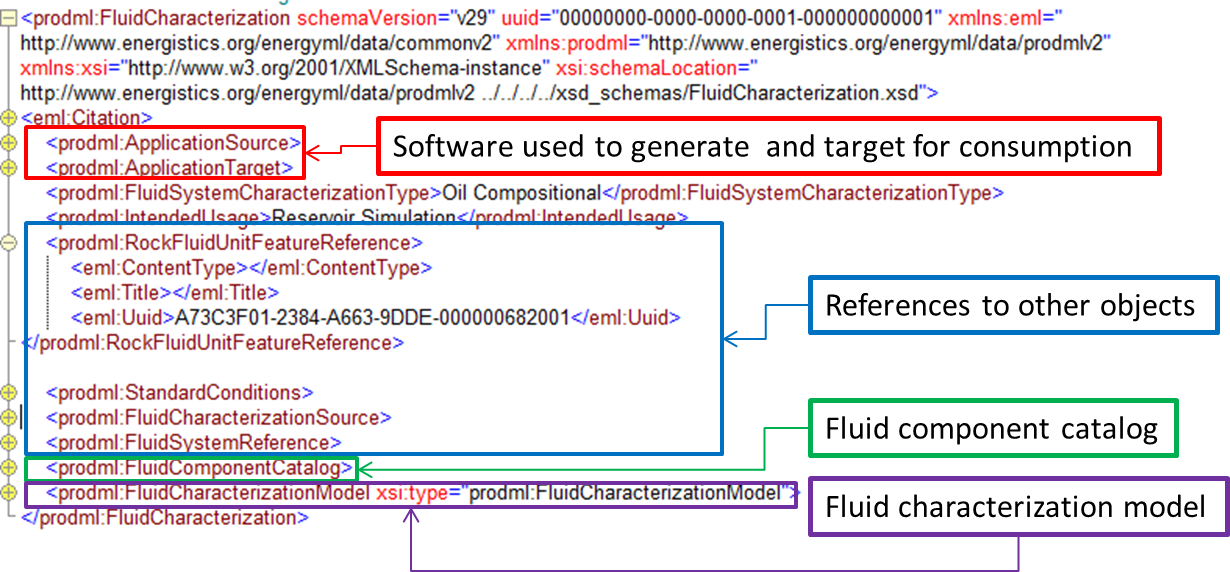
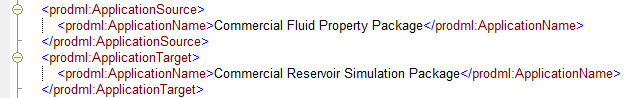
The software used to generate the characterization and its intended target software for consumption of the data can be reported (Figure 11.1.6-2).
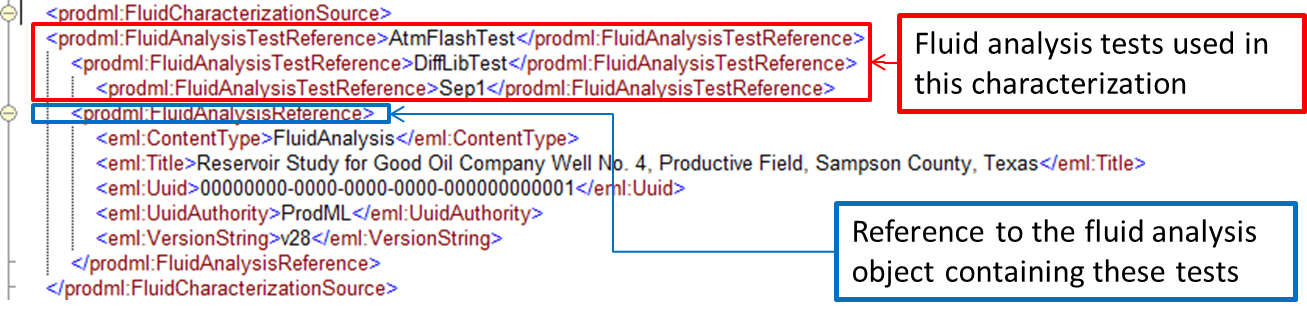
The source of the characterization means which fluid analysis tests results were used in this fluid characterization. This is done by referencing the UID of the tests concerned, with a reference to the parent fluid analysis data object, which can be seen in Figure 11.1.6-3 .
Standard conditions can be reported. Also possible, but not shown in the example, separation conditions (one or more stages plus stock tank conditions) can be reported, these being the conditions at which the fluid is characterized.
The fluid component catalog works the same way as for the fluid analysis example (see 11.1.5.1 Hydrocarbon Analysis ). The worked example does not use the same catalog as the analysis, instead having one with fewer components as would typically be used in software models.
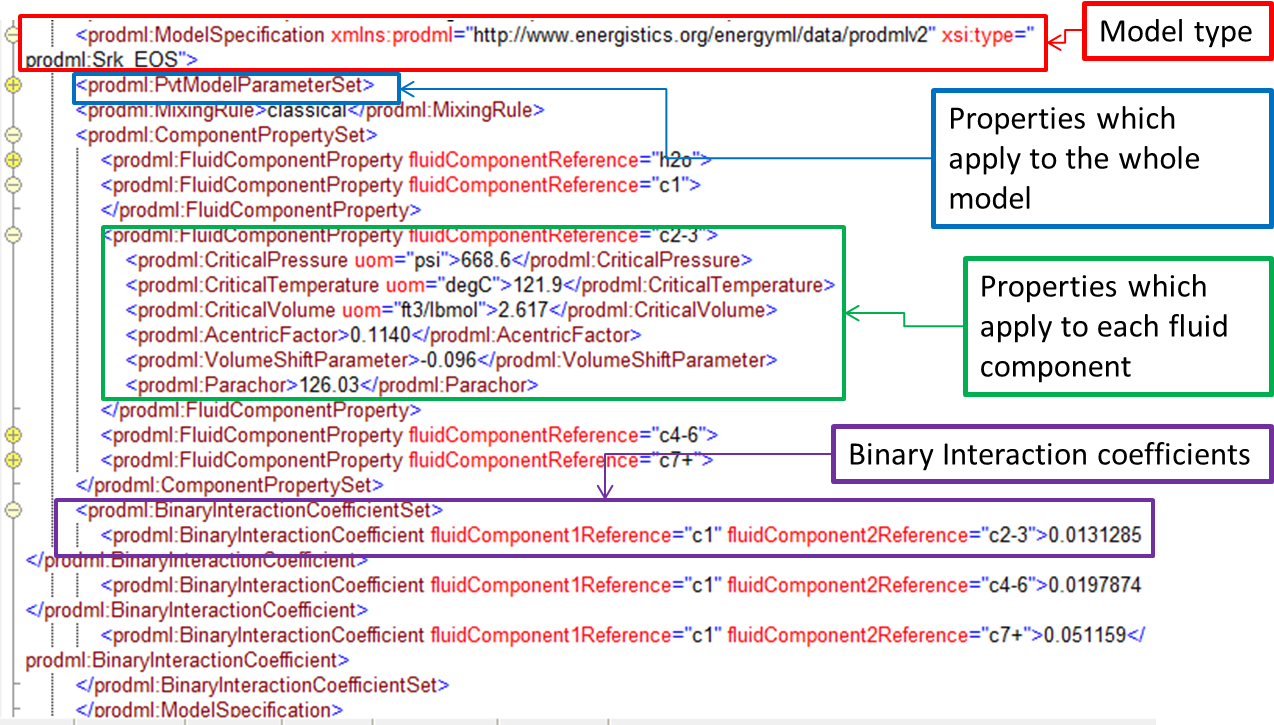
The model specification contains the different kinds of parameter appropriate to the model. Figure 11.1.6-4 shows the worked example. Note that the model type (seen at the top, red box) is one of the models listed in Section 12.2 PVT Models . Each of these model types has its own set of parameters which the schema enforces. See Figure 10.6.1-1 and Figure 10.6.1-2 for the concept behind this. Details are in the schema.
The tabular fluid characterization uses the following two main elements:
- One or more fluid characterization tables. These have table constants (per table). The data is then transferred in table rows within each table.
- One or more fluid characterization table formats. This contains table column headings (representing what the contents of a column are).
The UID of the fluid characterization table format is used in the fluid characterization table to show which format applies to the table (Figure 11.1.6-5).
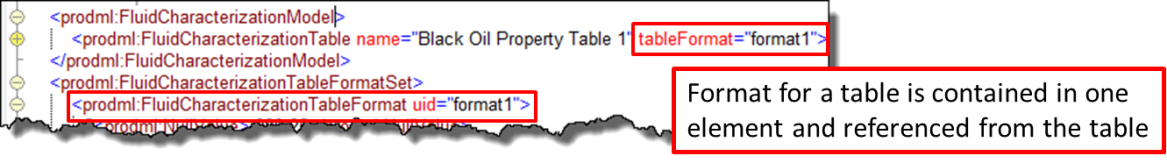
The table format defines the columns that appear in the table. It also defines the column delimiter asci character (e.g., a comma), and the null value (e.g., -999.25). The attributes of each column are as follows.
|
Attribute |
Description |
Optionality |
|---|---|---|
|
Name |
User-defined name for this attribute |
optional |
|
Sequence |
Integer to allow this column attribute to be indexed |
optional |
|
Property |
The physical property that this value represents |
mandatory |
|
Uom |
String to represent the unit of measure for the property values |
mandatory |
|
fluidComponentReference |
Reference to the fluid component to which this value relates |
optional |
|
Phase |
Reference to the phase to which this value relates |
optional |
|
KeywordAlias |
Used to apply a consumer product keyword to this value, with "authority" being the product name concerned |
Optional (zero to many) |
Property is an enumeration that can be extended and the properties are listed in Section 12.3 Fluid Properties that can be Output to Tables . Phase is also an enumeration and is listed in Section 12.3 Fluid Properties that can be Output to Tables . Phase and fluid component reference are provided so that properties may be output that relate to a specific phase or fluid component. Unit of measure is not a controlled list. Keyword alias is provided in case it is useful to map properties onto keywords in a specific software package.
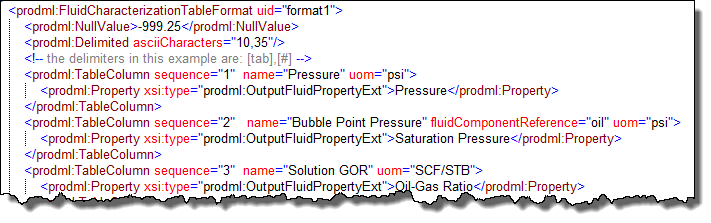
An example extract from the worked example fluid characterization table format is shown in Figure 11.1.6-6 .
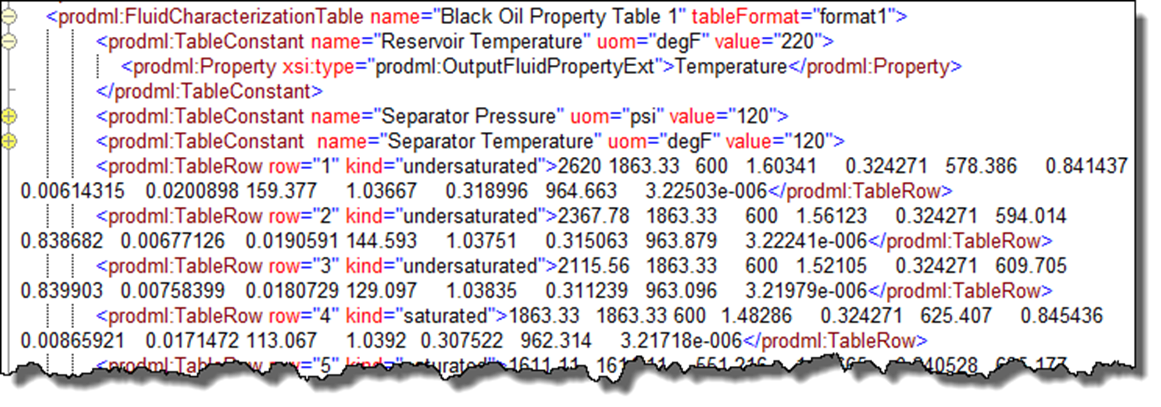
The fluid characterization table then contains the actual values defined by the format. These are contained in table row elements where the values are separated by the ASCII character defined above.
In addition to the table rows, the table also has table constants. These have the same attributes as listed above for table columns except that sequence is not present (tables do not have a sequence). A value attribute is added and is mandatory.
The table has a UID so that it can be referenced from elsewhere, and a name.
An example table is shown in Figure 11.1.6-7 .
The table example contains some other illustrations, e.g. an extension to the enum list of properties, which can be seen by inspecting the file.