18.1.2.1 Example: Intensity-Based, Single-Pulse DAS system
| Topic Version | 2 | Published | 04/16/2018 | |
| For Standard | PRODML v2.0 | |||
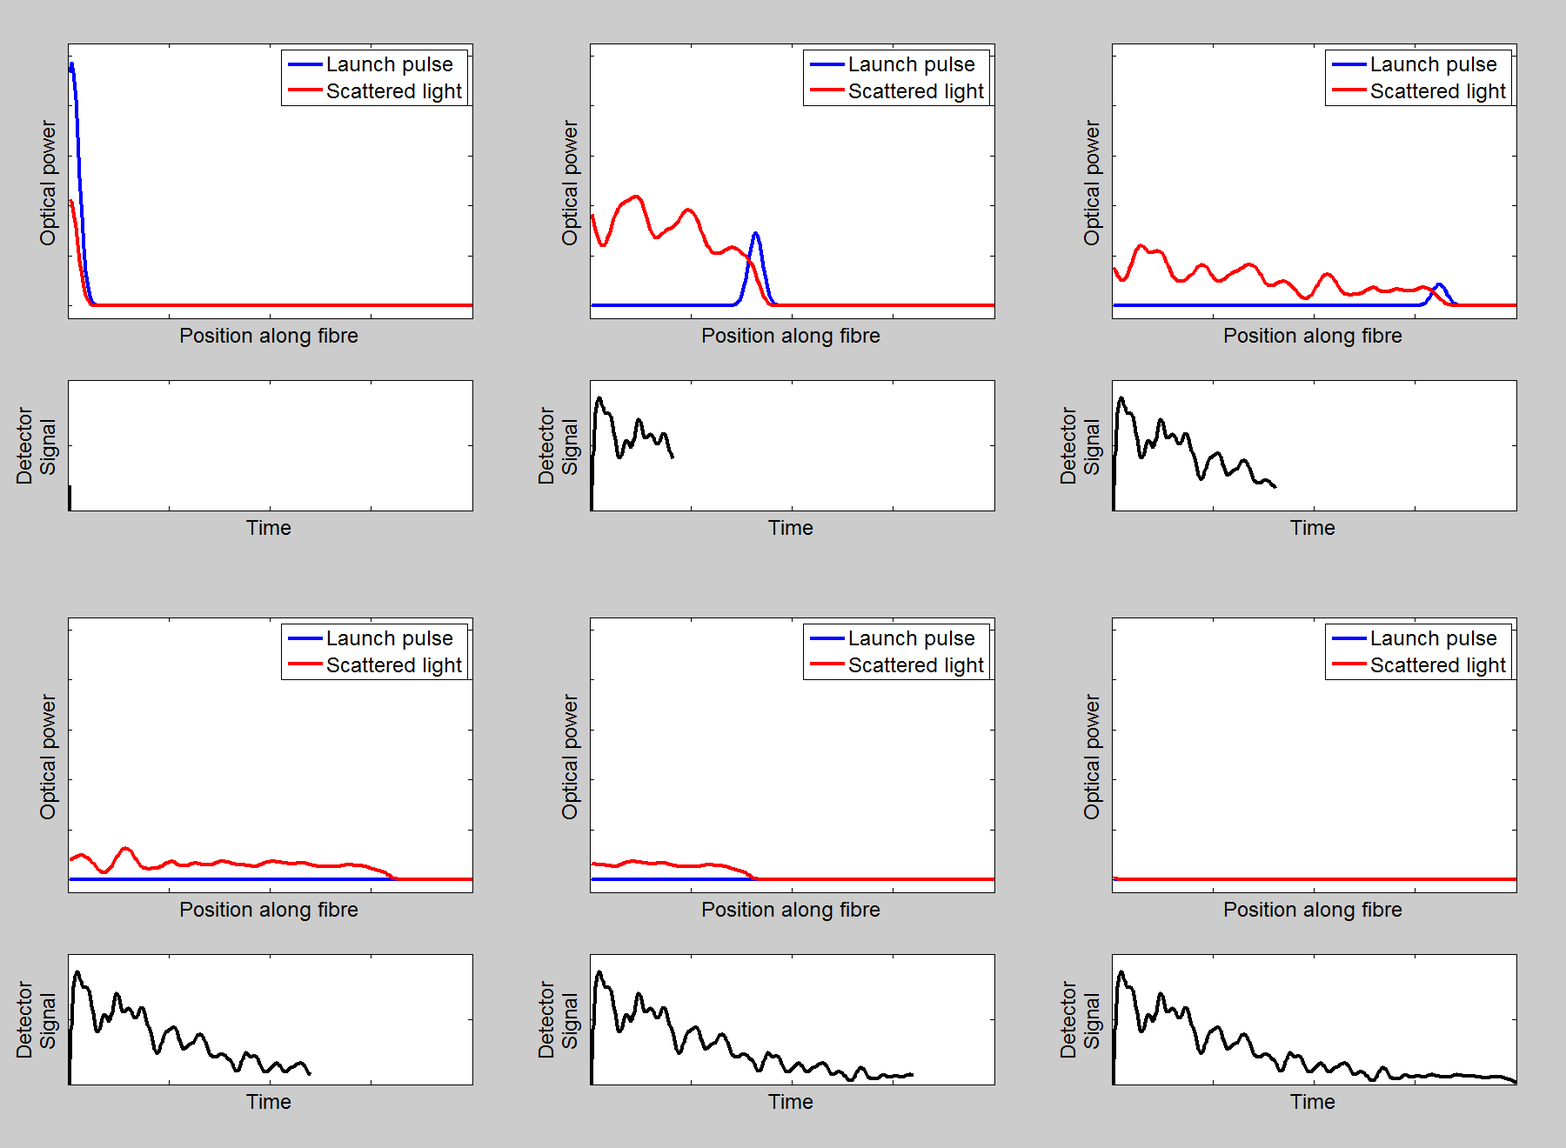
Figure 18.1.2.1-1 is a simple but effective animation that shows the scattered intensity as a function of time from a fiber illuminated by single pulse of coherent light. The important thing to note for the application of DAS is that, if the fiber is unperturbed, the scatter pattern generated by a fiber remains constant on successive pulses.
In coherent OTDR, a launch pulse travels along fiber scattering from tiny imperfections, inherent to the fiber. The scattered light is detected and used to create a signal for each location along the fiber, known as a scatter pattern. Because the intensity of this signal at each location is determined by the coherent addition of millions of waves scattered from millions of independent scatter sites, the intensity varies randomly as a function of distance. However, upon successive measurements, this pattern nominally remains constant.
The animation shows that when the pulse (blue) is sent down the fiber, as the pulse nears the end of the fiber, travelling from left to right, the back scattered light (red) from each point along the fiber is making its way back up the fiber towards the detector, from right to left.
