10.6.2 Tabular Output
| Topic Version | 1 | Published | 12/09/2016 | |
| For Standard | PRODML v2.0 | |||
In a tabular format, fluid properties (such as pressure, density, viscosity, etc.) are provided as rows of a table where a target application could use these fluid properties directly. The organization of each table is defined for each characterization file, and many table formats may be used in a single characterization. This organization gives the ordering, properties, and units of measure for each column, and allows constant values and delimiters to be assigned. Typical information found in a tabular format includes:
- Independent operating conditions such as pressure and temperature.
- Fluid properties such as oil and gas formation volume factor, solution gas or dissolved liquid, viscosity and compressibility.
- Slope of compressibility/formation volume factor vs. pressure line in the under-saturated region, if saturated fluid properties are provided.
- Tabular representation of k-values or component viscosities as a function of pressure and temperature.
- Miscibility tables in case of gas/solvent EOR fluid characterization.
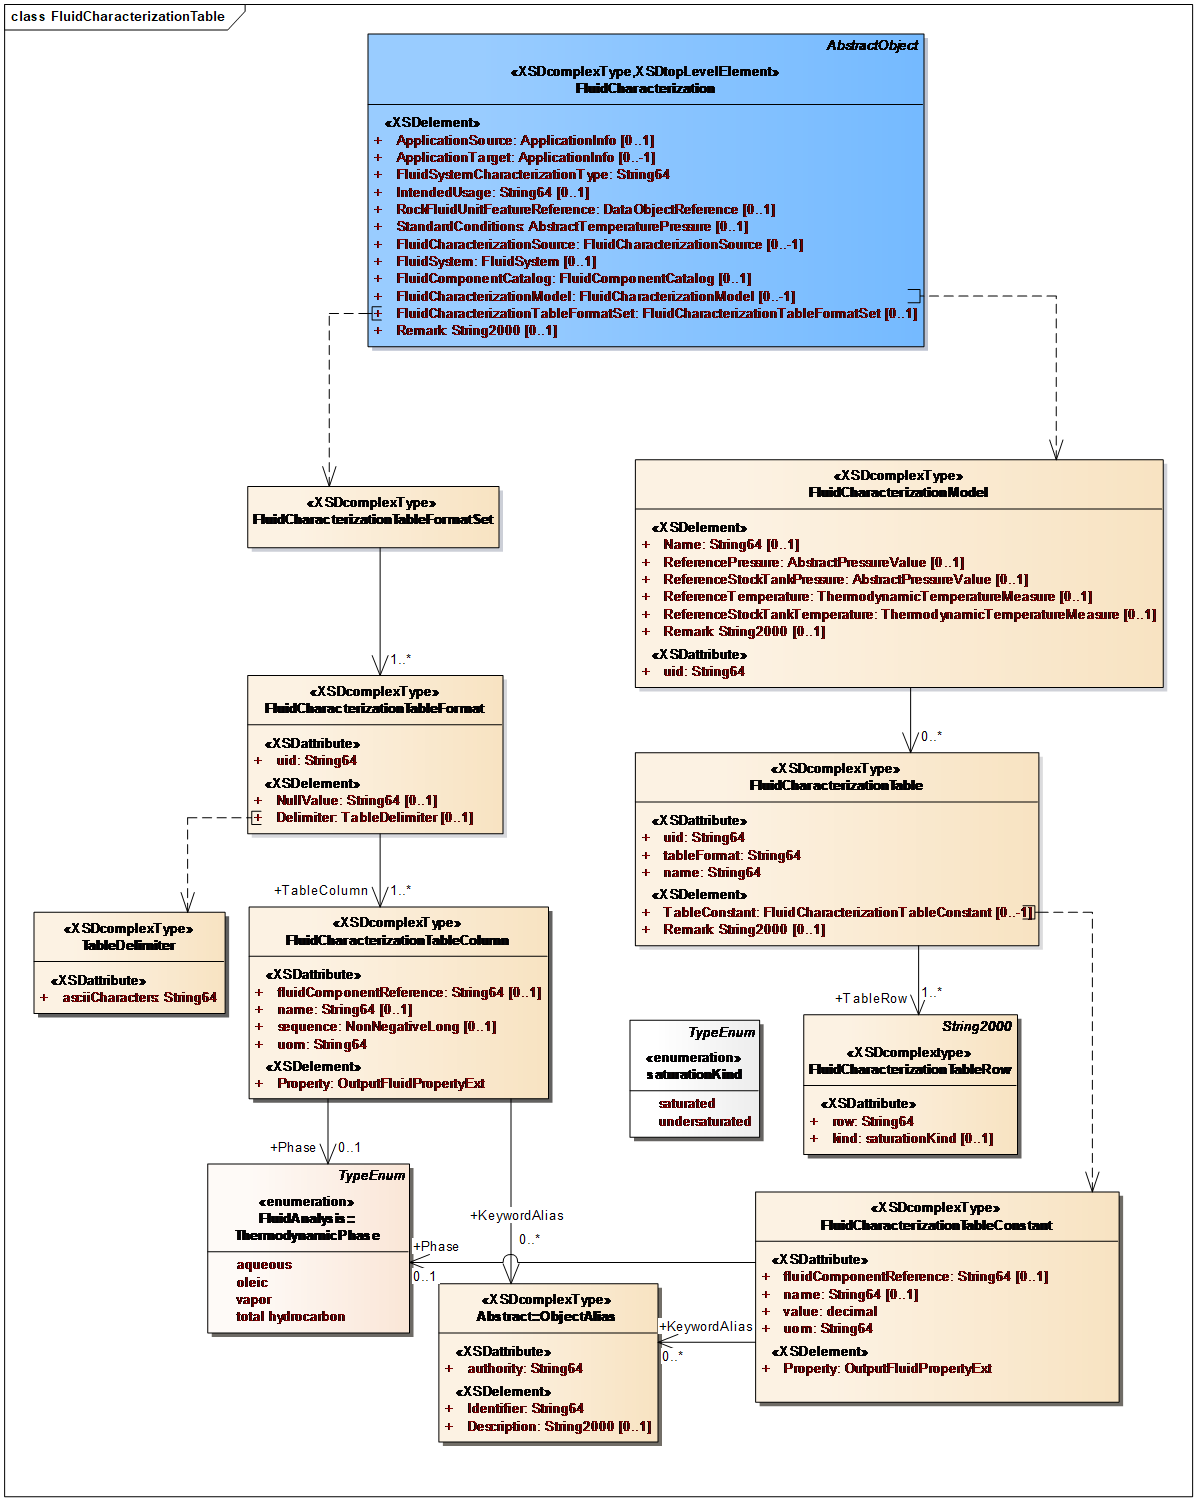
The organization of the tabular model is shown in Figure 10.6.2-1 . The table format defines null values and delimiters, plus a set of column headings which detail what comes in each column. The rows are then strings of delimited values (e.g., CSV) which contain the values in the columns, plus a saturated/under-saturated flag. Additionally, the table can contain table constants.