23.2 WftRun Data Object Outline
| Topic Version | 1 | Published | 12/09/2016 | |
| For Standard | PRODML v2.0 | |||
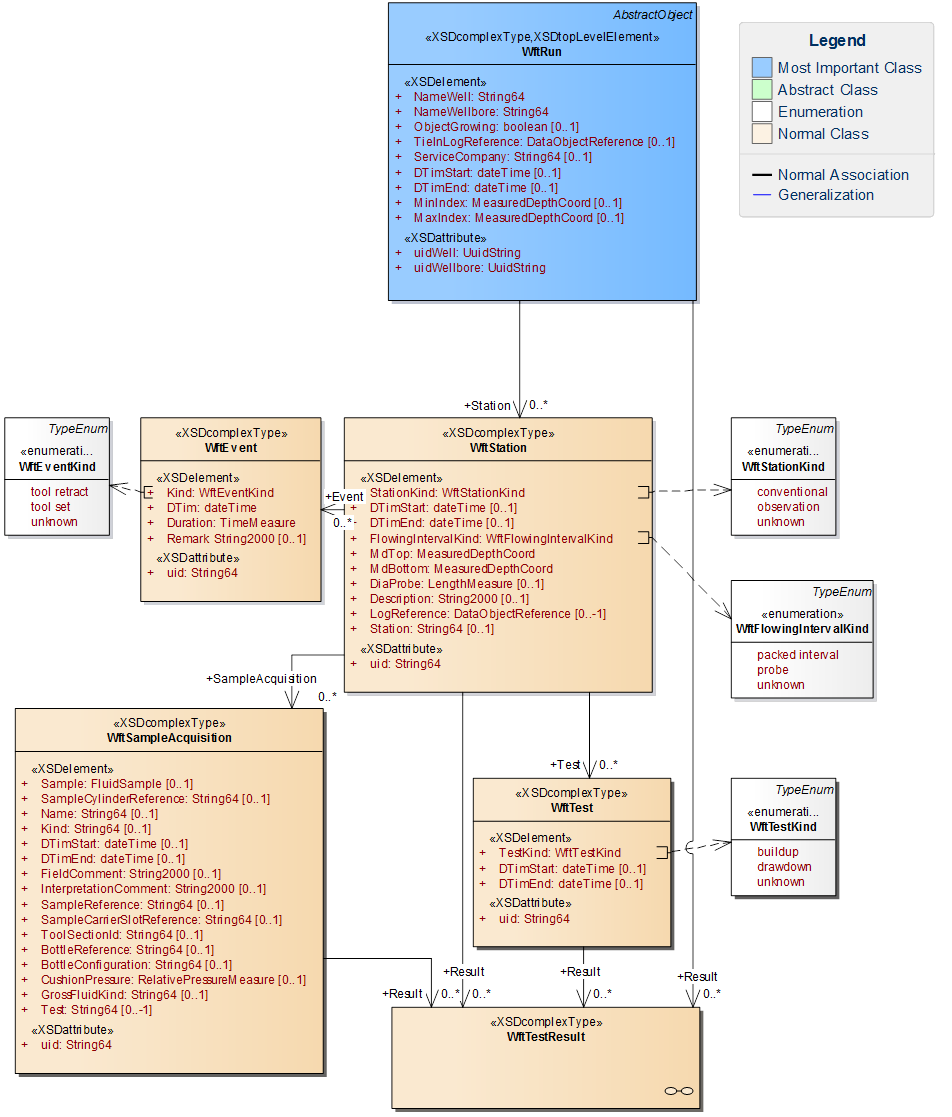
A top-level class diagram for the WftRun can be seen in Figure 23.2-1 . The major top-level elements of the data object are seen on the diagram and are as follows:
- WftRun – this describes the whole operation. It contains:
- Wellbore ref
- Time span
- Depth span
- Tie-in log refs
- Stations
- Results at wellbore level
- WftStation – this describes the data acquired at one Station, or flowing interval. It contains:
- Tests
- Samples
- Events
- Results at station level
- Test – to describe the events happening at a single Test within a Station (for example, a buildup test). It contains:
- Kind of test
- Test Data
- Results at test level
- Sample Acquisition – to describe how a fluid sample was collected. It contains:
- How the fluid sample was collected
- Test Data (e.g. time series data) pertaining to the Fluid Sample acquisition.
- Fluid Sample and Fluid Sample Container references – these relate the WftRun data object to the Fluid Sample and Fluid Sample Container data objects which comprise part of the Fluid and PVT Analysis section of PRODML. See Chapters 8 Introduction to Fluid and PVT Analysis Data Objects to 11 Fluid and PVT Analysis: Worked Examples for details.
- Event – this is to describe events happening at one Station (example, tool being set or unset). It comprises a set of tags on a timeline. It contains:
- Times
- Durations
- Event descriptions
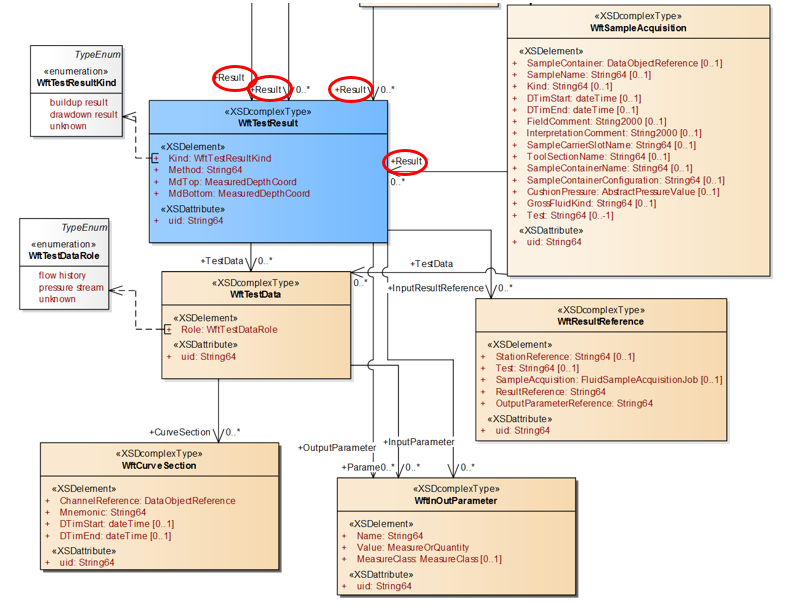
The results from a wireline formation tester can be generated at multiple levels, and these are all available by the links to the WftTestResult class from:
- WftRun top-level: for results which apply to the whole operation or wellbore (e.g. fluid gradients).
- Station: for results which apply to the Station level such as a static reservoir pressure.
- Test: for results which apply to a single test such as permeability.
- Sample: for results derived from a sample.
See Figure 23.2-2 for the classes involved in the reporting of results from a WFT run. In this diagram, note the red rings around the links showing that the WftTestResult element is used from all four levels of data acquisition listed above. The diagram shows how each instance of WftTestData has a Role (currently, flow or pressure) and then one or more curve sections will be expected—these are references to the time series data in WITSML Channel objects. (For more information, see the WITSML Technical Usage Guide).
Parameters can also be attached to test results, and these can be input or output to the result (so for example, thickness h will typically be an input parameter to a buildup test, and permeability k will be an output).
It is also possible to link the test result to use as input, the output from another test result. This is useful where, for example, a pressure gradient is to be reported, and it is important to know which results at each station were used—for example “the pressure extrapolation of buildup 3 at station 5”. This allows an audit trail through the results to be preserved.
For the further available documentation for this data object, see the slide set: WFT Run Overview.pptx which is provided in the folder: energyml\data\prodml\v2.0\doc in the Energistics downloaded files.