19.5.1 High-Level Conceptual Model
| Topic Version | 2 | Published | 04/16/2018 | |
| For Standard | PRODML v2.0 | |||
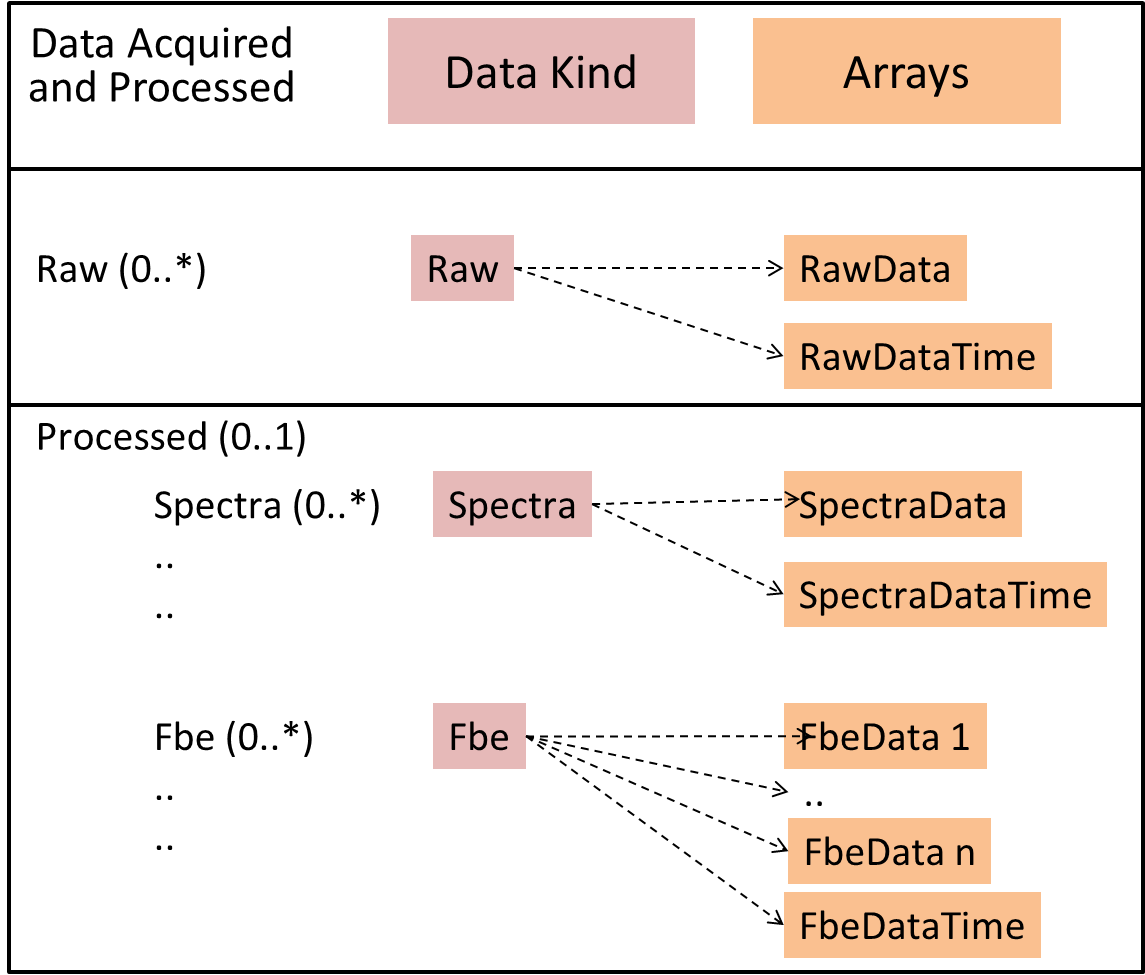
Figure 19.5.1-1 shows the high-level conceptual model for how raw and processed data are related. The orange “Arrays” boxes in the diagram refer to data arrays. In this model, a DAS Acquisition may have multiple raw arrays (0..*) and one processed array set, but the processed array set may have multiple spectra and FBE (0..*) arrays.
There are currently three types of data: raw data and two types of processed data: spectra and FBE.
Each type of data is captured by a set of metadata attributes and two arrays:
- the “data” array (the values of the measurements across time and across loci for raw and for FBE, and the values of Fourier transformed data across frequencies for the spectra)
- the “time” array (the sample times, often also referred to as scan times, which are common to all loci).