6.3.2 Worked Example Volumes Walkthrough
| Topic Version | 1 | Published | 12/09/2016 | |
| For Standard | PRODML v2.0 | |||
The worked example shows the various kinds of volumes and is explained by the content and order shown in Figure 6.3.1-1 .
Note that the volumes and flowrates in this report are assumed to be at the standard conditions which are provided one per asset production volumes transfer
#1 Multiple Entities Per Report
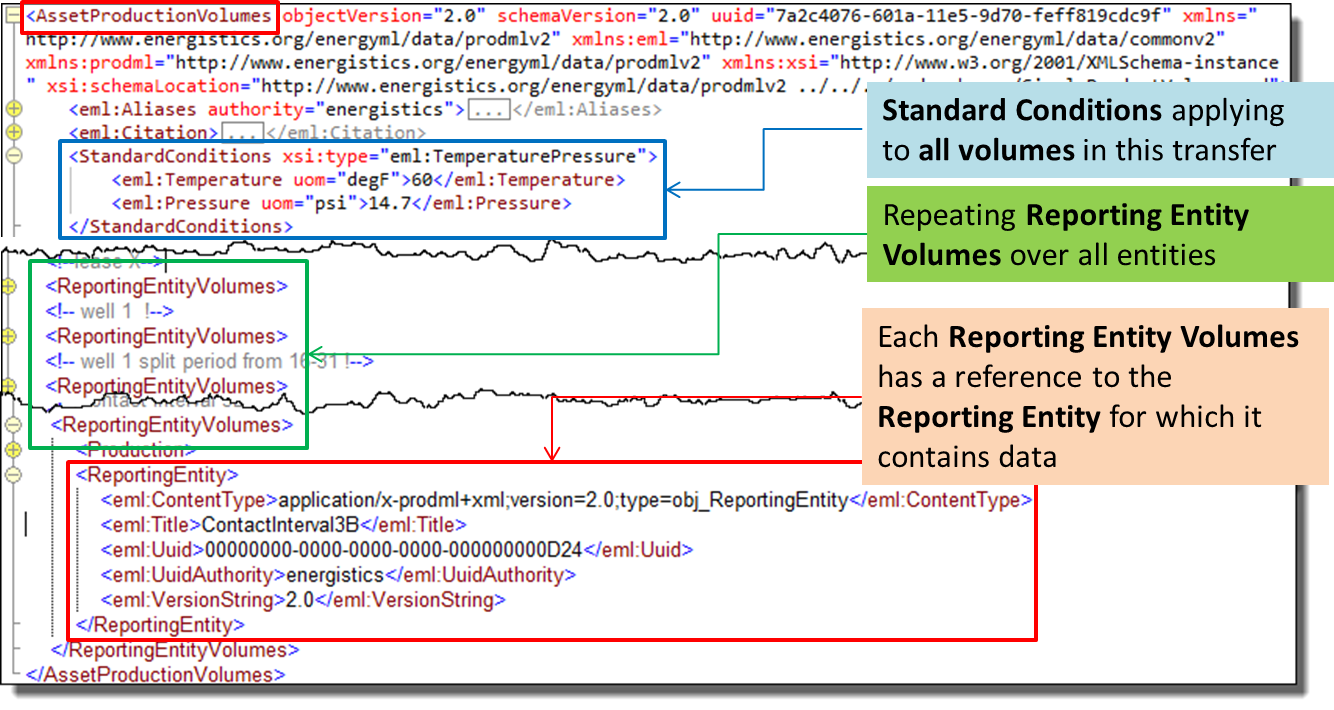
The asset production volumes object contains a repeating reporting entity volumes element, which repeats for each reporting entity. Figure 6.3.2-1 shows the asset production volumes XML data object, with a snippet showing some of the reporting entity volumes elements (in collapsed state, green box). The reporting entity element references the reporting entity (here, for Contact Interval 3B, red box). The standard conditions are transferred only once (and are mandatory) and apply to all volumes in this transfer.
#2 Different Volume Kinds Per Lease
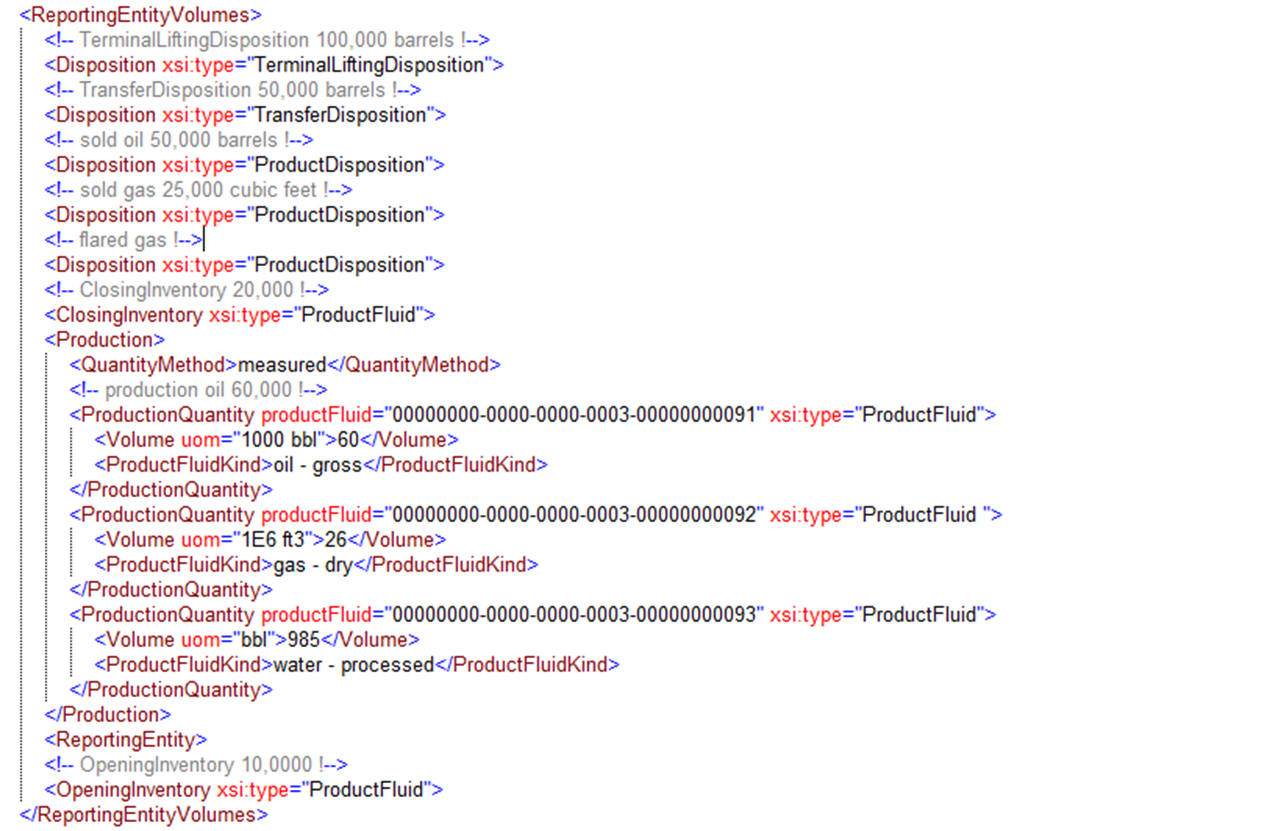
If you open any reporting entity volumes element, you can see the different volume types included (per the matrix in Figure 6.3.1-1 ). Figure 6.3.2-2 shows the volumes for the Lease X parent asset.
- Shown (details collapsed):
- Disposition: Terminal Lifting
- Disposition: Transfer
- Disposition: Product Sale
- Inventory: Opening
- Inventory: Closing
- Shown (details expanded):
- Production
- Not shown but available:
- Injection
- Deferred Production
#3 Use of Production Fluid Catalog and Quantity Method
Where the volumes are expanded in Figure 6.3.2-2 , you can see the reference to the corresponding fluid component in the fluid component catalog. Remember, each transfer requires only one fluid component catalog. It lists and characterizes all components needed. These could be any of the following, as examples:
- One each of oil, gas, water, in a simple black oil system.
- Multiple oils, etc., with different qualities such as gravities.
- Compositional with pure, pseudo and plus fractions.
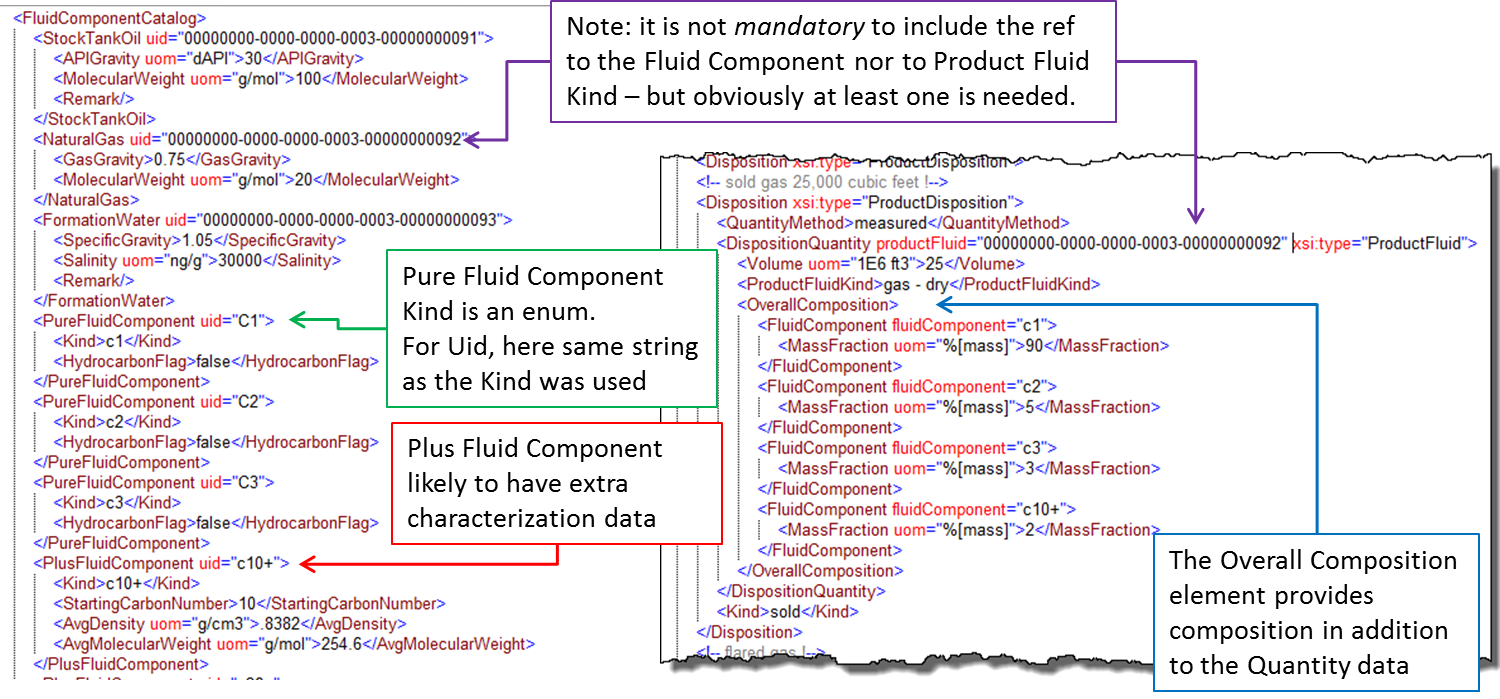
Figure 6.3.2-3 shows this in more detail, with the fluid component catalog for the asset product volumes example (left side of the figure, red box). The figure also shows three black oil type fluid components and below, some pure fluid components and plus fluid components.
The right side of the figure shows the production quantity element within (in this case) a production volume element, with the water used as an example as a reference (blue box). Note that because this referencing is within one XML data object, a UID rather than a UUID is used (the UID only needs be unique within the data object).
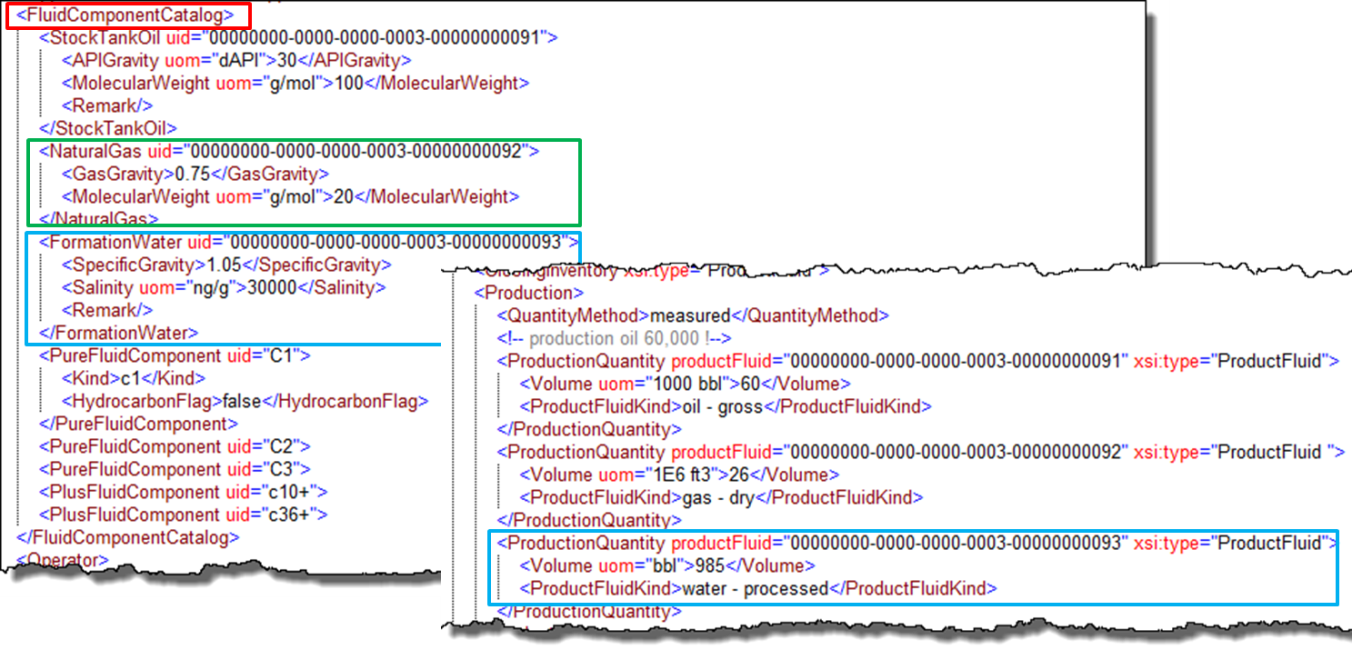
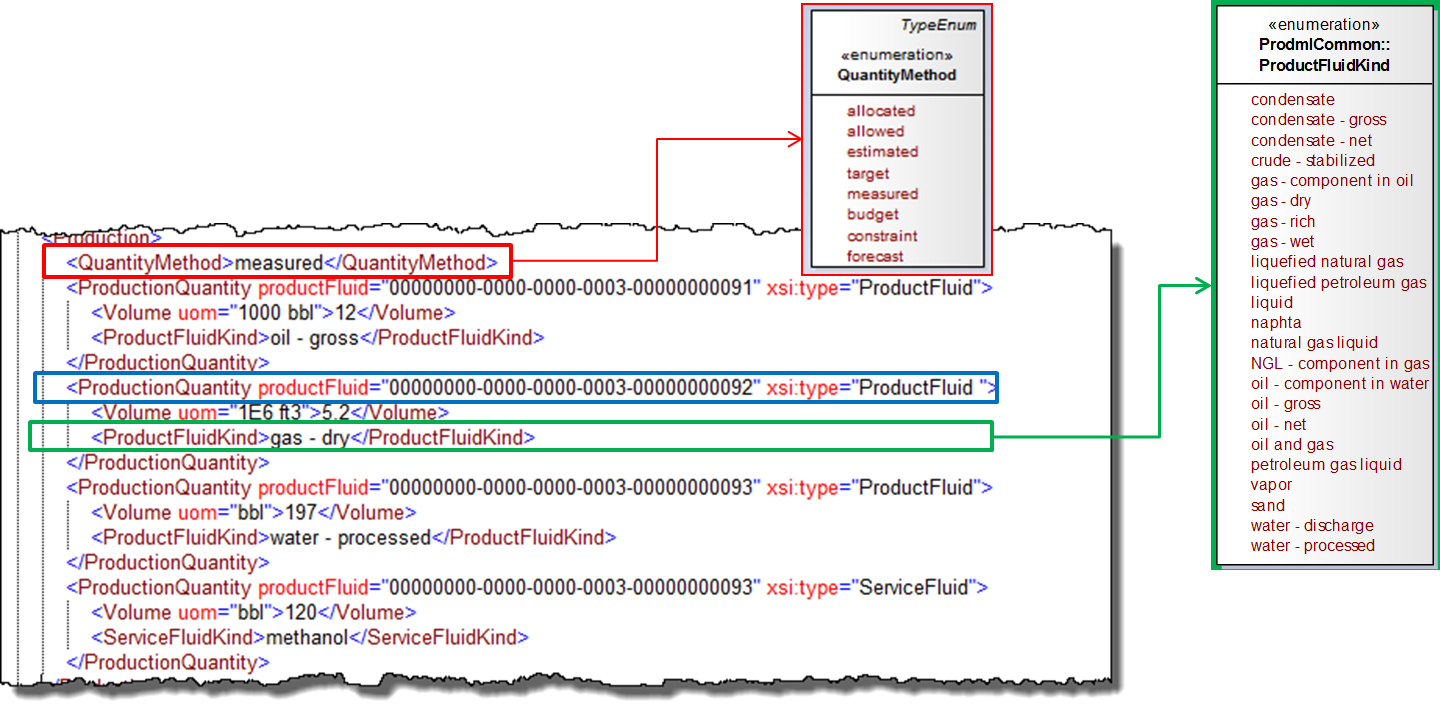
Figure 6.3.2-4 shows more details of the volume reporting.
- Every volume has a quantity method, which is an enumeration listing the ways in which that quantity was determined (red box).
- Every volume has a product fluid reference (per above, and blue box), which gives the physical properties of the component.
- Every volume also has a product fluid kind, which is a simple enumeration to provide information about the product that the production quantity represents (green box).
NOTE: It is not mandatory to include the reference to the fluid component or to product fluid kind. but obviously at least one is needed.
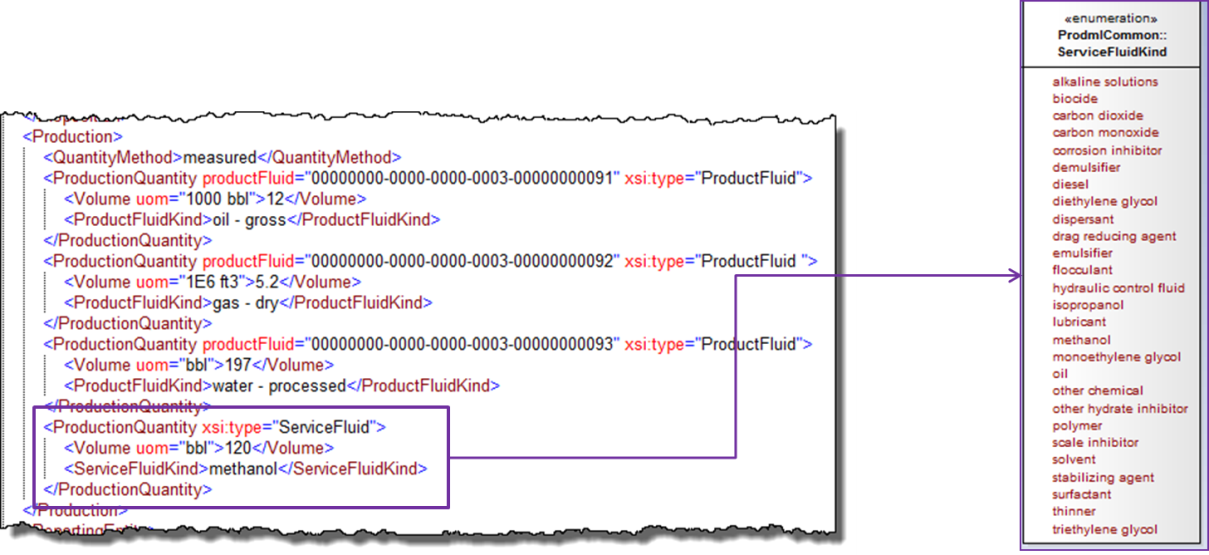
#4 Service Fluids
In addition to product fluids, service fluids can be reported. Figure 6.3.2-5 shows an example. Service fluids are reported only by a service fluid kind enumeration. NOT by a reference to the fluid component catalog (a product fluid ref for the product fluid types). In other words, service fluids has no catalog, only the enumerated list shown in Figure 6.3.2-5 (purple box).
#5 CompositionalFluid Reporting
Figure 6.3.2-6 shows how compositional reporting of fluid is done. In this example, the fluid component catalog (left side of figure) has in addition to the black oil components, compositional components C1, C2 and C3 (green box) and a C10+ plus component (red box). Pseudo and plus components can contain additional data about them in the catalog (e.g., molecular weight).
The right side shows the use of the overall composition element, which is optional for any volume. It shows the references to the compositional components and their fractions—mass in this example (blue box). Note that the black oil description is also used, showing the volume of type gas (purple arrows).
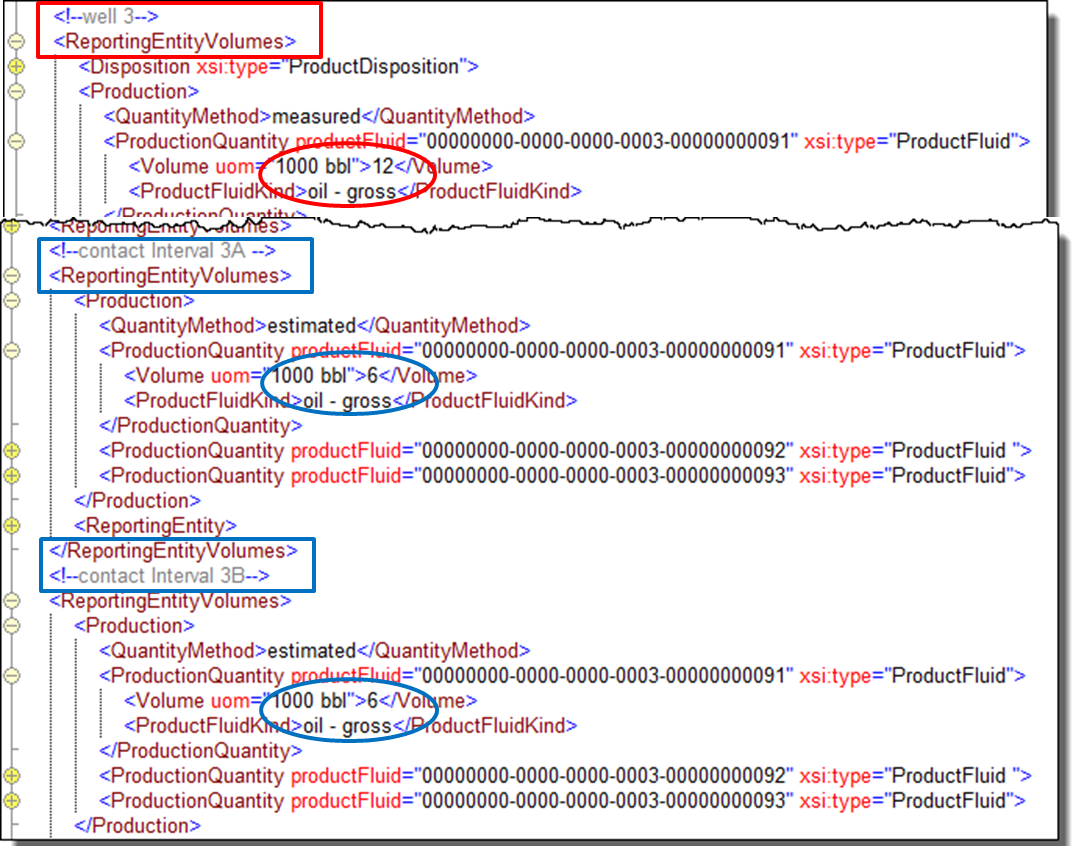
#6 Allocation to Layer Level
A requirement is to be able to allocate volumes into reservoir layers where required, in commingled systems. This is done in the worked example for well 03 which is completed in two reservoirs, the connections being represented by two wellbore completions. See Figure 6.1-1 .
The pattern of reporting volumes does not change. You only need to include the level of detail that is needed in the reporting entities and hierarchies (as shown), and then to reference these as shown in Figure 6.3.2-7 . Note that by way of illustration, the quantity method for these two entities is “estimated” (being downhole, unless we have metering downhole).
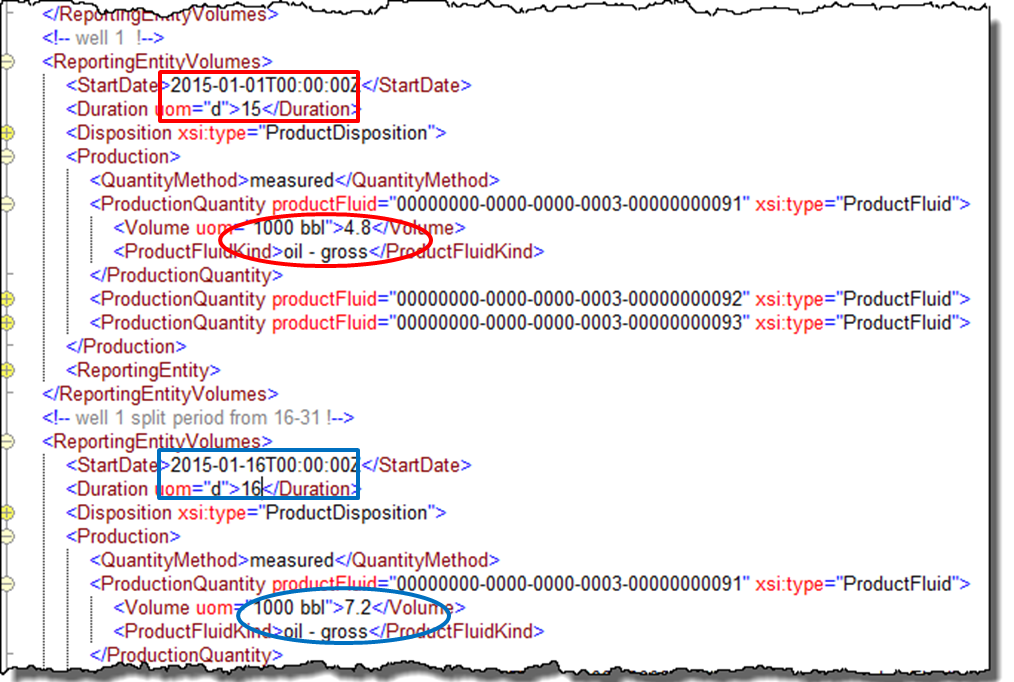
#7 Split Period Due to Choke Change
A further requirement is to be able to report allocated volumes across sub-periods within the overall reporting period. For example, when you need to report a well being shut in for some of the period, and where its flow would be all allocated to the flowing period. The worked example shows an example of a choke change part way through the period. To see how this is done, see Figure 6.3.2-8 .
Multiple sub-periods can be defined using the optional start time and duration elements within the reporting entity volumes. In this case, there are two reporting entity volumes for the entity concerned (well 01), one for each sub-period. The figure shows the start date, duration, and volumes for this entity for the first period (red boxes) and second period (blue boxes).
To see how the changing choke settings (in this example) are transferred for these same periods, see 6.4.2 Well Production Parameters .
#8 Deferred Production
Deferred production can be reported using the specific element for this, deferred production event. Figure 6.3.2-9 shows the worked example. A deferred production event sits under a reporting entity volumes, which associates it with a specific entity. Each event has a start and end time and a duration. The duration is mandatory and the times are optional because you may not always know exactly when a failure occurred.
With the deferred production quantity, an estimation method enumeration can be included, which lists the various ways in which deferred volumes can be calculated.
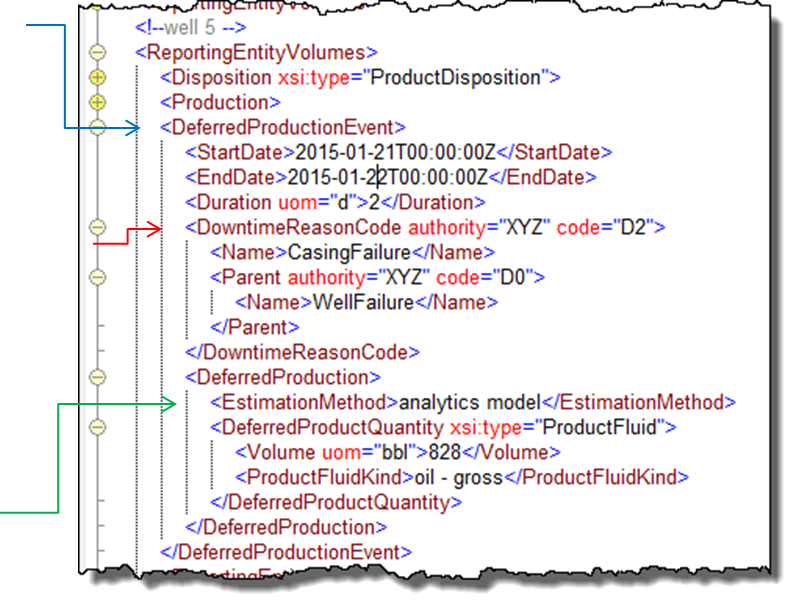
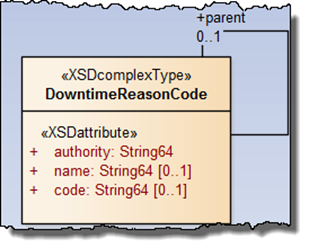
There is a code for downtime reason. Because the codes are company specific, they are not part of the standard. Figure 6.3.2-10 shows the UML for the downtime reason code. These can be arranged in any desired hierarchy. In the example, two levels of code are shown. Use the authority element used to record which company (or standard) codes are being used.
#9 Transfer or Terminal Lifting
A transfer or terminal lifting can happen at any time during the period being reported. There is a choice of using a standalone data object transfer each time this happens, or of incorporating the data within the periodic report (using asset production volumes).
- Section 6.4.3 Transfer describes the transfer as a standalone.
- Section 6.4.4 Terminal Lifting describes the terminal lifting as a standalone.
- Section 6.4.5 Transfer and Terminal Lifting as Dispositions within Periodic Asset Production Volumes Reporting describes how these can be incorporated within the asset production volumes data object.